Chart reading
what this tests
Read a value off a randomly generated bar chart.
Charts encode values in geometry, not text — reading one accurately means mapping pixels back to the axis scale.
Grading: Value questions accept a small tolerance (chart reading is deliberately approximate); count-above-threshold and title questions are exact.
sample image · fixed demo seed, never used in live runs
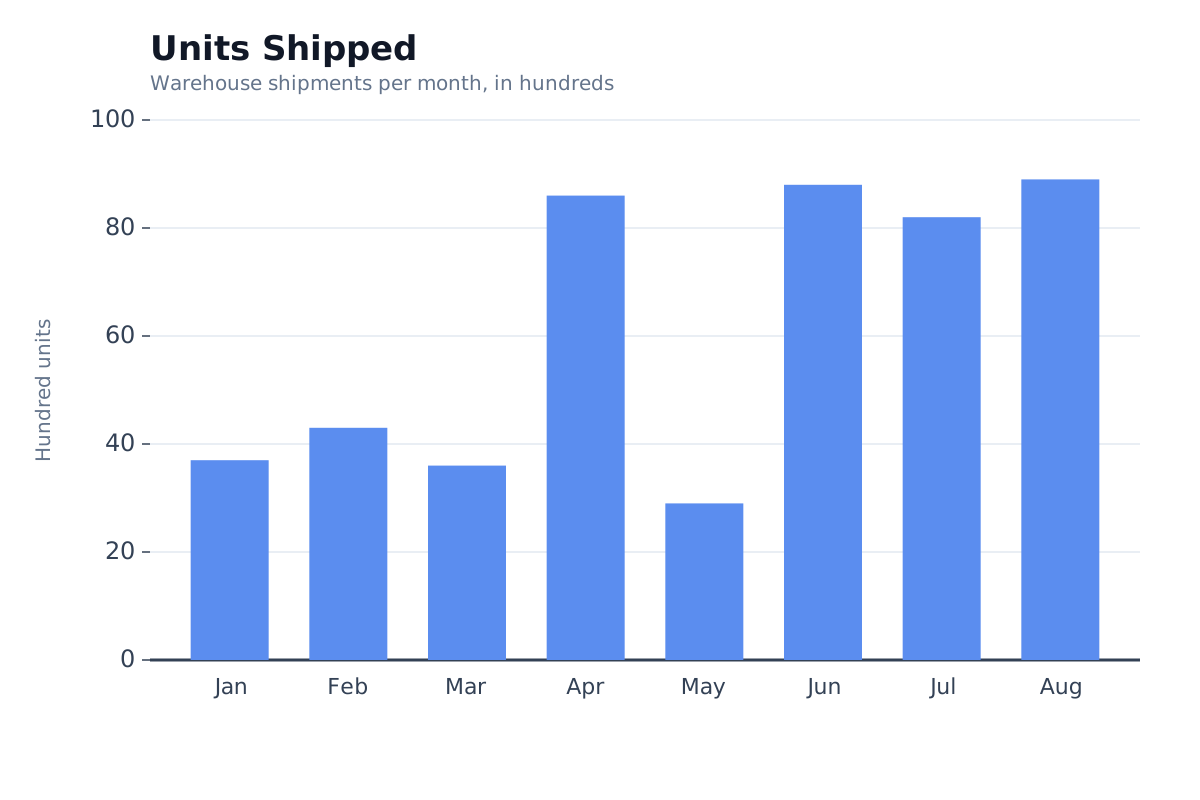
Dynamic challenge — the prompt is generated per run from a seed, so each run gets a different instance.
generate
(function (a) {
function svgDocument(width, height, body, fill = "#fffdf8") {
return `<svg xmlns="http://www.w3.org/2000/svg" width="${width}" height="${height}" viewBox="0 0 ${width} ${height}"><rect width="100%" height="100%" fill="${fill}"/>${body}</svg>`;
}
function shapeSvg(shape, x, y, color, size) {
if (shape === "circle")
return `<circle cx="${x}" cy="${y}" r="${size}" fill="${color}"/>`;
if (shape === "square")
return `<rect x="${x - size}" y="${y - size}" width="${size * 2}" height="${size * 2}" rx="3" fill="${color}"/>`;
if (shape === "diamond")
return `<path d="M ${x} ${y - size} L ${x + size} ${y} L ${x} ${y + size} L ${x - size} ${y} Z" fill="${color}"/>`;
return `<path d="M ${x} ${y - size} L ${x + size} ${y + size} L ${x - size} ${y + size} Z" fill="${color}"/>`;
}
const MASK64 = (1n << 64n) - 1n;
const GOLDEN_GAMMA = 0x9e3779b97f4a7c15n;
function createRng(seed) {
let state = seed & MASK64;
return () => {
state = (state + GOLDEN_GAMMA) & MASK64;
let z = state;
z = ((z ^ (z >> 30n)) * 0xbf58476d1ce4e5b9n) & MASK64;
z = ((z ^ (z >> 27n)) * 0x94d049bb133111ebn) & MASK64;
z = z ^ (z >> 31n);
return Number(z >> 11n) / 9007199254740992;
};
}
function pick(rnd, arr) {
return arr[Math.floor(rnd() * arr.length)];
}
function int(rnd, lo, hi) {
return lo + Math.floor(rnd() * (hi - lo + 1));
}
const ACUITY_CHARSET = "ABCDEFGHJKMNPQRSTUVWXYZ23456789".split("");
const EYE_CHART_ROW_SIZES = [56, 40, 28, 20, 14, 10, 8];
const COLOR_NAMES = [
["blue", "#2463eb"],
["red", "#dc2626"],
["green", "#16a34a"],
["orange", "#f26a22"],
["purple", "#7c3aed"],
["teal", "#0891b2"],
];
const SHAPE_NAMES = ["circle", "square", "triangle", "diamond"];
const MONTHS = ["Jan", "Feb", "Mar", "Apr", "May", "Jun", "Jul", "Aug"];
const PRODUCT_NAMES = [
"Wireless Mouse", "USB-C Cable", "Notebook", "Desk Lamp", "Coffee Mug",
"Phone Stand", "Water Bottle", "Backpack", "Keyboard", "Screen Cleaner",
"Sticky Notes", "Ballpoint Pen", "Laptop Sleeve", "Mouse Pad", "Headphones",
];
const CHART_TEMPLATES = [
{ title: "Monthly Active Users", subtitle: "Unique users per month, in thousands", yAxisLabel: "Thousand users" },
{ title: "Website Sessions", subtitle: "Sessions per month, in thousands", yAxisLabel: "Thousand sessions" },
{ title: "Support Tickets Opened", subtitle: "New tickets per month", yAxisLabel: "Tickets" },
{ title: "Units Shipped", subtitle: "Warehouse shipments per month, in hundreds", yAxisLabel: "Hundred units" },
{ title: "New Signups", subtitle: "New account signups per month", yAxisLabel: "Signups" },
{ title: "Server Incidents", subtitle: "Reported incidents per month", yAxisLabel: "Incidents" },
];
const VISION_FAMILIES = [
"acuity-48", "acuity-24", "acuity-12", "acuity-8",
"counting", "spatial", "chart", "screenshot",
];
const ACUITY_TARGET_ROW = {
"acuity-48": 4,
"acuity-24": 5,
"acuity-12": 6,
"acuity-8": 7,
};
function acuityAnswer(rnd, family) {
const rows = [];
for (let r = 0; r < EYE_CHART_ROW_SIZES.length; r += 1) {
const groups = [];
for (let g = 0; g < 3; g += 1) {
let code = "";
for (let i = 0; i < 5; i += 1)
code += pick(rnd, ACUITY_CHARSET);
groups.push(code);
}
rows.push(groups);
}
const targetRow = ACUITY_TARGET_ROW[family];
const targetGroup = int(rnd, 1, 3);
const expectedAnswer = rows[targetRow - 1][targetGroup - 1];
return {
family,
prompt: `This is an eye chart with 7 numbered rows, each containing 3 groups of 5 characters. ` +
`Read row ${targetRow}, group ${targetGroup} (groups are numbered left to right). What are the 5 characters, in order?`,
expectedAnswer,
width: 1366,
height: 768,
rows,
targetRow,
targetGroup,
};
}
function countingAnswer(rnd) {
const [targetColorName, targetColorHex] = pick(rnd, COLOR_NAMES);
const targetShape = pick(rnd, SHAPE_NAMES);
const n = int(rnd, 5, 14);
const distractorCount = int(rnd, 6, 10);
const total = n + distractorCount;
const slots = [];
for (let row = 0; row < 4; row += 1) {
for (let col = 0; col < 6; col += 1) {
slots.push([160 + col * 180, 180 + row * 190]);
}
}
const shuffled = [...slots];
for (let i = shuffled.length - 1; i > 0; i -= 1) {
const j = int(rnd, 0, i);
[shuffled[i], shuffled[j]] = [shuffled[j], shuffled[i]];
}
const used = shuffled.slice(0, total);
const distractorOptions = COLOR_NAMES.filter(([name]) => name !== targetColorName).flatMap(([, hex]) => SHAPE_NAMES.filter((shape) => !(shape === targetShape && hex === targetColorHex)).map((shape) => [shape, hex]));
const items = [];
for (let i = 0; i < total; i += 1) {
const [x, y] = used[i];
const jitterX = int(rnd, -20, 20);
const jitterY = int(rnd, -20, 20);
if (i < n) {
items.push({ x: x + jitterX, y: y + jitterY, shape: targetShape, color: targetColorHex });
}
else {
const [shape, hex] = pick(rnd, distractorOptions);
items.push({ x: x + jitterX, y: y + jitterY, shape, color: hex });
}
}
return {
family: "counting",
prompt: `How many ${targetColorName} ${targetShape}s are in the image?`,
expectedAnswer: String(n),
width: 1200,
height: 900,
items,
};
}
function spatialAnswer(rnd) {
const targetRow = int(rnd, 0, 4);
const targetCol = int(rnd, 0, 4);
const nonRedColors = COLOR_NAMES.filter(([name]) => name !== "red").map(([, hex]) => hex);
const cells = [];
for (let row = 0; row < 5; row += 1) {
for (let col = 0; col < 5; col += 1) {
if (row === targetRow && col === targetCol) {
cells.push({ shape: "circle", color: "#dc2626" });
}
else {
cells.push({ shape: pick(rnd, SHAPE_NAMES), color: pick(rnd, nonRedColors) });
}
}
}
return {
family: "spatial",
prompt: "Which cell contains the red circle?",
expectedAnswer: `row ${targetRow + 1}, column ${targetCol + 1}`,
width: 1200,
height: 1200,
cells,
};
}
const CHART_YMAX = 100;
const CHART_YTICK = 20;
const CHART_QUESTION_KINDS = ["approx-value", "count-above", "approx-diff", "title"];
function drawChartValues(rnd) {
let values;
do {
values = MONTHS.map(() => int(rnd, 10, 95));
} while (values.some((v) => v % CHART_YTICK === 0));
return values;
}
const COUNT_ABOVE_MIN_MARGIN = 6;
function chartAnswer(rnd) {
const template = pick(rnd, CHART_TEMPLATES);
let values = drawChartValues(rnd);
const base = {
family: "chart",
width: 1200,
height: 800,
title: template.title,
subtitle: template.subtitle,
yAxisLabel: template.yAxisLabel,
values,
yMax: CHART_YMAX,
yTick: CHART_YTICK,
};
const questionKind = pick(rnd, CHART_QUESTION_KINDS);
switch (questionKind) {
case "approx-value": {
const idx = int(rnd, 0, MONTHS.length - 1);
return {
...base,
questionKind,
tolerance: 5,
prompt: `Using the "${template.title}" chart, approximately what value did ${MONTHS[idx]} have? ` +
`Read it off the y-axis; answers within +/-5 are accepted.`,
expectedAnswer: String(values[idx]),
};
}
case "count-above": {
const MAX_THRESHOLD_ATTEMPTS = 200;
let threshold = 0;
let count = 0;
let margin = 0;
let attempts = 0;
do {
if (attempts > 0 && attempts % MAX_THRESHOLD_ATTEMPTS === 0) {
values.splice(0, values.length, ...drawChartValues(rnd));
}
threshold = int(rnd, 15, 90);
count = values.filter((v) => v > threshold).length;
margin = Math.min(...values.map((v) => Math.abs(v - threshold)));
attempts += 1;
} while (count === 0 || count === values.length || margin < COUNT_ABOVE_MIN_MARGIN);
return {
...base,
questionKind,
tolerance: 0,
prompt: `Using the "${template.title}" chart, how many months had a value greater than ${threshold}? Answer with just the number.`,
expectedAnswer: String(count),
};
}
case "approx-diff": {
let i = 0;
let j = 0;
do {
i = int(rnd, 0, MONTHS.length - 1);
j = int(rnd, 0, MONTHS.length - 1);
} while (i === j);
const diff = Math.abs(values[i] - values[j]);
return {
...base,
questionKind,
tolerance: 8,
prompt: `Using the "${template.title}" chart, approximately what is the difference in value between ${MONTHS[i]} and ${MONTHS[j]}? ` +
`Answers within +/-8 are accepted.`,
expectedAnswer: String(diff),
};
}
case "title":
return {
...base,
questionKind,
tolerance: 0,
prompt: "What is the title shown at the top of this chart?",
expectedAnswer: template.title,
};
}
}
function screenshotAnswer(rnd) {
const itemCount = int(rnd, 3, 5);
const namesPool = [...PRODUCT_NAMES];
const items = [];
for (let i = 0; i < itemCount; i += 1) {
const idx = int(rnd, 0, namesPool.length - 1);
const [name] = namesPool.splice(idx, 1);
const qty = int(rnd, 1, 4);
const priceCents = int(rnd, 499, 4999);
items.push({ name, qty, price: priceCents / 100 });
}
const total = items.reduce((sum, item) => sum + item.qty * item.price, 0);
return {
family: "screenshot",
prompt: "What is the total amount shown in the cart panel?",
expectedAnswer: `$${total.toFixed(2)}`,
width: 1400,
height: 1000,
items,
};
}
function computeFixtureAnswer(input) {
const rnd = createRng(input.seed);
switch (input.family) {
case "acuity-48":
case "acuity-24":
case "acuity-12":
case "acuity-8":
return acuityAnswer(rnd, input.family);
case "counting":
return countingAnswer(rnd);
case "spatial":
return spatialAnswer(rnd);
case "chart":
return chartAnswer(rnd);
case "screenshot":
return screenshotAnswer(rnd);
default: {
const exhaustive = input.family;
throw new Error(`computeFixtureAnswer: unknown family ${String(exhaustive)}`);
}
}
}
function escXml(s) {
return s.replace(/&/g, "&").replace(/</g, "<").replace(/>/g, ">");
}
const EYE_CHART_GUTTER_X = 70;
const EYE_CHART_GROUP_X = [380, 683, 986];
function renderAcuitySvg(answer) {
let baseline = 96;
let body = "";
for (let r = 0; r < EYE_CHART_ROW_SIZES.length; r += 1) {
const size = EYE_CHART_ROW_SIZES[r];
const spacing = (size * 0.14).toFixed(2);
body += `<text x="${EYE_CHART_GUTTER_X}" y="${baseline}" font-family="DejaVu Sans, sans-serif" font-size="22" fill="#64748b">${r + 1}</text>`;
for (let g = 0; g < 3; g += 1) {
body += `<text x="${EYE_CHART_GROUP_X[g]}" y="${baseline}" font-family="DejaVu Sans, sans-serif" font-size="${size}" font-weight="700" letter-spacing="${spacing}" fill="#111827">${escXml(answer.rows[r][g])}</text>`;
}
if (r < EYE_CHART_ROW_SIZES.length - 1) {
baseline += Math.round(size * 1.15) + 46;
}
}
const frame = `<rect x="2" y="2" width="1362" height="764" fill="none" stroke="#e2e8f0" stroke-width="2"/>`;
return svgDocument(1366, 768, frame + body, "#ffffff");
}
function renderCountingSvg(answer) {
const body = answer.items.map((item) => shapeSvg(item.shape, item.x, item.y, item.color, 55)).join("");
return svgDocument(1200, 900, body);
}
function renderSpatialSvg(answer) {
let body = "";
for (let row = 0; row < 5; row += 1) {
for (let col = 0; col < 5; col += 1) {
const cell = answer.cells[row * 5 + col];
const x = 120 + col * 235;
const y = 120 + row * 235;
body += `<rect x="${x - 100}" y="${y - 100}" width="200" height="200" rx="4" fill="#ffffff" stroke="#cbd5e1" stroke-width="4"/>${shapeSvg(cell.shape, x, y, cell.color, 62)}`;
}
}
return svgDocument(1200, 1200, body);
}
const CHART_L = 150;
const CHART_R = 1140;
const CHART_T = 120;
const CHART_B = 660;
const CHART_BAR_WIDTH = 78;
function renderChartSvg(answer) {
const n = MONTHS.length;
const gap = (CHART_R - CHART_L - n * CHART_BAR_WIDTH) / (n + 1);
const pxPerUnit = (CHART_B - CHART_T) / answer.yMax;
let body = "";
for (let t = 0; t <= answer.yMax; t += answer.yTick) {
const y = CHART_B - t * pxPerUnit;
body +=
t === 0
? `<path d="M${CHART_L} ${y}H${CHART_R}" stroke="#334155" stroke-width="3"/>`
: `<path d="M${CHART_L} ${y}H${CHART_R}" stroke="#e2e8f0" stroke-width="1.5"/>`;
body += `<path d="M${CHART_L - 8} ${y}H${CHART_L}" stroke="#334155" stroke-width="1.5"/>`;
body += `<text x="${CHART_L - 16}" y="${(y + 7).toFixed(2)}" text-anchor="end" font-family="DejaVu Sans, sans-serif" font-size="24" fill="#334155">${t}</text>`;
}
for (let i = 0; i < n; i += 1) {
const x = CHART_L + gap * (i + 1) + CHART_BAR_WIDTH * i;
const barHeight = answer.values[i] * pxPerUnit;
const y = CHART_B - barHeight;
body += `<rect x="${x.toFixed(2)}" y="${y.toFixed(2)}" width="${CHART_BAR_WIDTH}" height="${barHeight.toFixed(2)}" fill="#5b8def"/>`;
body += `<text x="${(x + CHART_BAR_WIDTH / 2).toFixed(2)}" y="${CHART_B + 34}" text-anchor="middle" font-family="DejaVu Sans, sans-serif" font-size="22" fill="#334155">${escXml(MONTHS[i])}</text>`;
}
const midY = (CHART_T + CHART_B) / 2;
body += `<text x="50" y="${midY}" text-anchor="middle" font-family="DejaVu Sans, sans-serif" font-size="20" fill="#64748b" transform="rotate(-90 50 ${midY})">${escXml(answer.yAxisLabel)}</text>`;
body += `<text x="${CHART_L}" y="60" font-family="DejaVu Sans, sans-serif" font-size="34" font-weight="700" fill="#111827">${escXml(answer.title)}</text>`;
body += `<text x="${CHART_L}" y="90" font-family="DejaVu Sans, sans-serif" font-size="20" fill="#64748b">${escXml(answer.subtitle)}</text>`;
return svgDocument(1200, 800, body, "#ffffff");
}
function renderScreenshotSvg(answer) {
const rowsY = 240;
const rowHeight = 90;
const unitX = 1030;
const lineTotalX = 1320;
let rows = "";
answer.items.forEach((item, index) => {
const y = rowsY + index * rowHeight;
const lineTotal = (item.qty * item.price).toFixed(2);
rows += `<text x="80" y="${y}" font-family="DejaVu Sans, sans-serif" font-size="32" fill="#1f2937">${escXml(item.name)}</text>`;
rows += `<text x="900" y="${y}" text-anchor="middle" font-family="DejaVu Sans, sans-serif" font-size="32" fill="#1f2937">x${item.qty}</text>`;
rows += `<text x="${unitX}" y="${y}" text-anchor="middle" font-family="DejaVu Sans, sans-serif" font-size="32" fill="#1f2937">$${item.price.toFixed(2)}</text>`;
rows += `<text x="${lineTotalX}" y="${y}" text-anchor="end" font-family="DejaVu Sans, sans-serif" font-size="32" fill="#1f2937">$${lineTotal}</text>`;
});
const dividerY = rowsY + answer.items.length * rowHeight - 40;
const totalY = dividerY + 70;
const body = `
<rect x="40" y="40" width="1320" height="920" rx="16" fill="#ffffff" stroke="#cbd5e1" stroke-width="3"/>
<text x="80" y="120" font-family="DejaVu Sans, sans-serif" font-size="40" font-weight="700" fill="#111827">AboStore - Cart</text>
<path d="M80 155H1320" stroke="#e2e8f0" stroke-width="2"/>
<text x="80" y="185" font-family="DejaVu Sans, sans-serif" font-size="26" fill="#64748b">Item</text>
<text x="900" y="185" text-anchor="middle" font-family="DejaVu Sans, sans-serif" font-size="26" fill="#64748b">Qty</text>
<text x="${unitX}" y="185" text-anchor="middle" font-family="DejaVu Sans, sans-serif" font-size="26" fill="#64748b">Unit</text>
<text x="${lineTotalX}" y="185" text-anchor="end" font-family="DejaVu Sans, sans-serif" font-size="26" fill="#64748b">Line Total</text>
${rows}
<path d="M80 ${dividerY}H1320" stroke="#334155" stroke-width="3"/>
<text x="80" y="${totalY}" font-family="DejaVu Sans, sans-serif" font-size="36" font-weight="700" fill="#111827">Total</text>
<text x="${lineTotalX}" y="${totalY}" text-anchor="end" font-family="DejaVu Sans, sans-serif" font-size="36" font-weight="700" fill="#111827">${answer.expectedAnswer}</text>
`;
return svgDocument(1400, 1000, body, "#f1f5f9");
}
const rnd = createRng(BigInt(a.seed));
const answer = chartAnswer(rnd);
const svg = renderChartSvg(answer);
const promptLines = [`Look at the image at {{image}} (fetch it and view it).`, answer.prompt];
const CHART_FORMAT_LINES = { "approx-value": "", "count-above": "", "approx-diff": "", "title": "Answer with just the chart title." };
const chartFormatLine = CHART_FORMAT_LINES[answer.questionKind];
if (chartFormatLine) promptLines.push(chartFormatLine);
const prompt = promptLines.join("\n");
const expected = { questionKind: answer.questionKind, value: answer.expectedAnswer, tolerance: answer.tolerance };
return { prompt: prompt, expected: expected, images: [{ svg: svg, width: answer.width, height: answer.height }] };
})evaluate
(function (a) {
  function stripDigitGroupCommas(text) {
    return text.replace(/(?<=\d),(?=\d)/g, "");
  }
  const NUMBER_TOKEN = /-?\d+/;
  function numericTokenMatches(submission, expected) {
    const match = stripDigitGroupCommas(submission).match(NUMBER_TOKEN);
    return match !== null && Number(match[0]) === Number(expected);
  }
  function numericTokenMatchesApprox(submission, expected, tolerance) {
    const match = stripDigitGroupCommas(submission).match(NUMBER_TOKEN);
    return match !== null && Math.abs(Number(match[0]) - Number(expected)) <= tolerance;
  }
  function normalizeText(s) {
    return String(s).replace(/\$/g, "").trim().replace(/^["'.]+|["'.]+$/g, "").trim().replace(/\s+/g, " ").toLowerCase();
  }
  const exp = a.expected;
  let ok;
  switch (exp.questionKind) {
    case "approx-value":
    case "approx-diff":
      ok = numericTokenMatchesApprox(a.submission, exp.value, exp.tolerance);
      break;
    case "count-above":
      ok = numericTokenMatches(a.submission, exp.value);
      break;
    case "title":
      ok = normalizeText(a.submission) === normalizeText(exp.value);
      break;
    default:
      ok = false;
  }
  return { pass: ok, score: ok ? 1 : 0, detail: ok ? undefined : ("expected " + JSON.stringify(exp) + ", got \"" + a.submission + "\"") };
})
submissions (3)
qwen38-27b gx10failqwen38-27banswer hidden on published runs2026-08-17 21:38
question
Look at the image at https://airbench.ai/i/459cd672595ab03edac1685ef7d6678f.png (fetch it and view it). Using the "Website Sessions" chart, approximately what value did Feb have? Read it off the y-axis; answers within +/-5 are accepted.
Qwen38_27b with opencode on a gx10pass · 1qwen38-27banswer hidden on published runs2026-08-17 15:55
question
Look at the image at https://airbench.ai/i/cd63d59dc17bff251b3cf53390e8dc45.png (fetch it and view it). Using the "Support Tickets Opened" chart, approximately what value did Aug have? Read it off the y-axis; answers within +/-5 are accepted.
damien claude testpass · 1claude-opus-4-8answer hidden on published runs2026-07-31 16:14
question
Look at the image at https://airbench.ai/i/864fb12d0bdff666502fac81a3ed3710.png (fetch it and view it). Using the "Website Sessions" chart, how many months had a value greater than 25? Answer with just the number.